Game Complexity and Ratings on BoardGameGeek

A few days ago, on Twitter, I asked Brian Henk to suggest a question related to the BGG data set. He replied that he’s curious about quantifying BGG’s bias towards heavier games. I thought it was a fascinating question and dug right into it.
Disclaimer: correlation vs bias
A true study of BGG’s bias would require surveying the general population and then looking at BGG users as a subset of it.
Complicating matters, ratings are naturally subjective. It is impossible to disentangle “prejudice” towards certain properties from the “inherent value” of a game. Because, of course, no such thing as the universal inherent value of a game even exists.
What we can measure, and what I will be looking at here, is the correlation between game complexity and rating. While this correlation is compelling, its existence in itself is insufficient proof of bias. And the same correlation may or may not also exist in the general population of board game players.
All that said and out of the way, let’s have fun with the correlation.
My goals for this article are:
See if there is a correlation between the game's Average Complexity and Average Rating.
Quantify it.
Come up with a hypothetical correction formula that can be applied to any game’s rating to normalize it in relation to its complexity.
The correlation
Let’s take a look at the data. We’ll be using a snapshot of BGG data from November 10, 2020. For the purposes of this research, we’ll only count the titles that satisfy the following criteria:
30+ complexity votes
30+ rating votes
That leaves us with 4,621 game titles. Let’s look at the relationship between Average Rating and Average Complexity for these games. Each dot represents one game title.

Let’s evaluate the correlation. One way would be to calculate the linear least-squares regression.
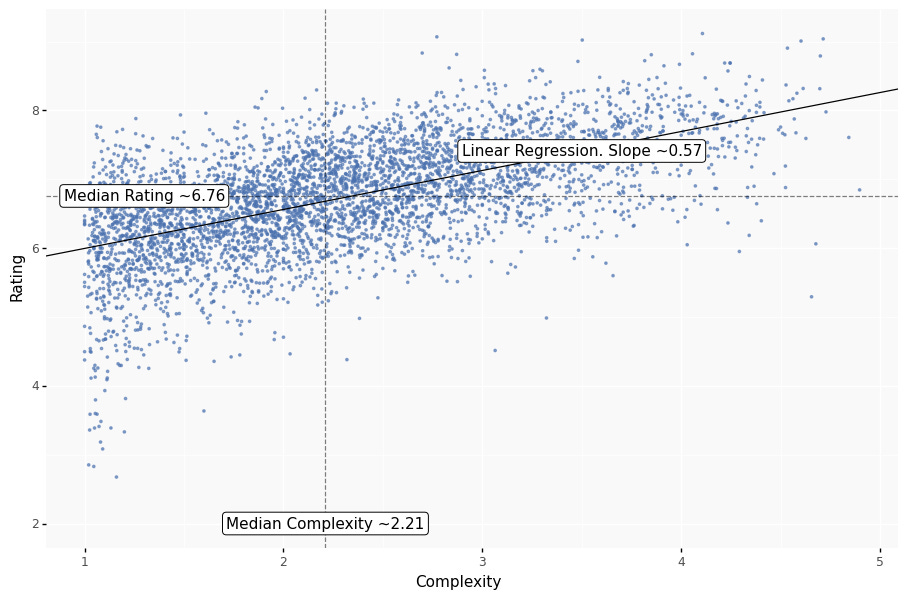
The R-squared is 0.35. That means that ~35% of the variance in rating can be explained by variance in complexity. And the P-value is 0, which means the probability of such correlation happening by chance is close to 0.
The slope is ~0.57. And that can be roughly interpreted as “For every increase by 1 in complexity, a rating of an average game of that complexity is likely to increase by 0.57”.
Let’s verify this assumption by dividing the games into four buckets by complexity: 1 to 2, 2 to 3, 3 to 4, and 4 to 5. We will then calculate the median rating for each bucket.
The difference between median ratings in each bucket is roughly consistent with the slope we calculated earlier. The difference in rating between the median game of the 1 to 2 bucket and 4 to 5 bucket is ~1.41.
Adjusting the rating
As discussed above, we cannot talk about correcting the bias here, because we haven’t really been measuring it. We can, however, try to come up with a rating adjustment that takes into account how much harder it is to get rating points for lighter games.
One way to achieve that is to add rating points to the games proportional to the slope of the regression. This way the regression line will flatten and we’ll be looking at our original regression’s residual plot. We also need to choose a level of complexity as standard (i.e., the complexity for which the rating will remain unchanged). The mathematically obvious choice is to use the median complexity. But if we do that, all games lighter than 2.21 will be upgraded, and games heavier than 2.21 will be downgraded.
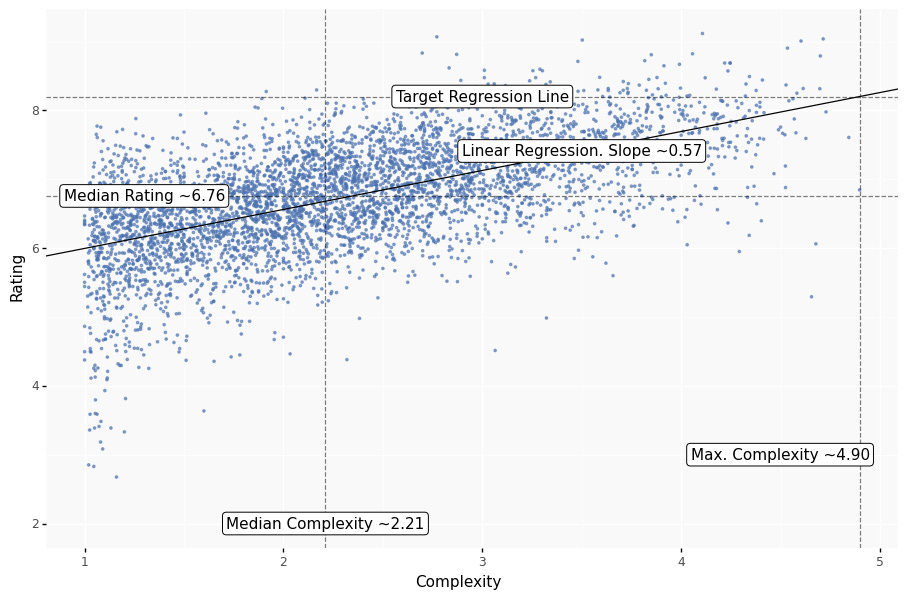
But I hate to take rating points off any game, even hypothetically! So let’s choose the maximum complexity as standard. That way we won’t be downgrading any games, only adding points to the lighter ones.
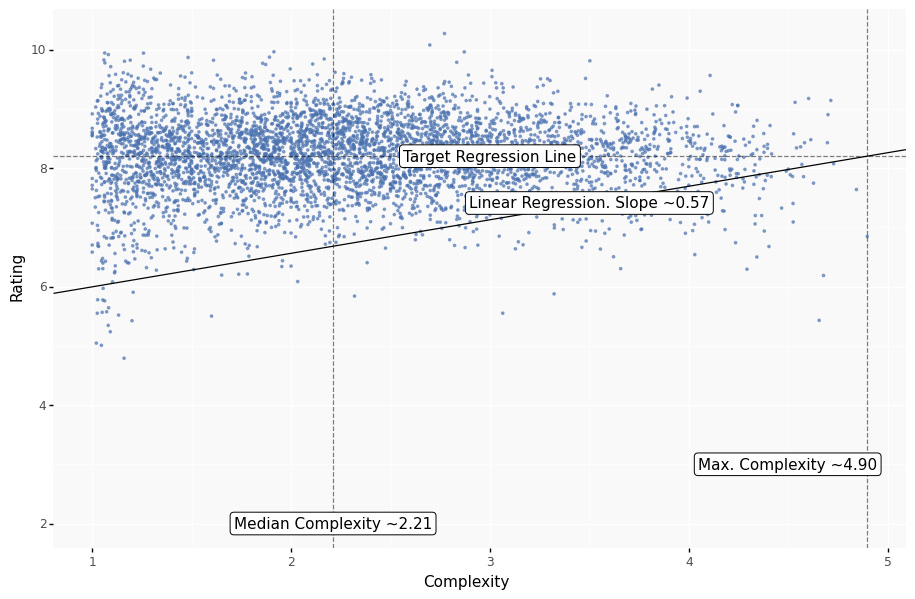
A fun side effect of this is that many games now have a rating higher than 10. Yay!
If you want to see the corrected average rating of your favorite game, the formula is as follows:
CorrectedAverageRating
= AverageRating + LRSlope * (MaxComplexity - Complexity)
= AverageRating + 0.57 * (4.9 - Complexity)
The slope of the GeekRating is a bit more slight:
CorrectedGeekRating
= GeekRating + GeekRLRSlope * (MaxComplexity - Complexity)
= GeekRating + 0.23 * (4.9 - Complexity)
I made this simple online calculator for you to check the adjusted rating of your favorite game. Let me know how much of a rating bump it got!
Thank you for reading! If you enjoyed this post, feel free to subscribe to this free newsletter and follow me on twitter.
Other articles discussing the issue
An analysis of board games: Part II - Complexity bias in BGG
December 8, 2018 by Dinesh Vatvani
I love the animated chart in Dinesh’s article. He takes a very similar approach of flattening the regression line in order to adjust the rating. The focus of his article are the top 100 games on BGG. Using his adjustment, he builds a new Top 100 ranking that places lighter popular games at the top. His article was written in 2018, and I’m interested to see how the adjusted rankings would look now. I might look into that in one of my future posts.
Looking at a Board Game Collection Like a Data Scientist
May 25, 2020 by Maddy Doak, Josh Reiss
A more recent article that discusses the existence and significance of the correlation between complexity and rating.
This is an interesting analysis. I think novelty bias in games also skew the rating. Newer games tend to get higher ratings than games that are at least 10 years old, especially those from Kickstarters or are highly anticipated. We can catch a glimpse of this trend from game rankings in BGG vs. time. A successful game typically has a quick and steep rise, followed by a leveling off and slight decline over time.